

Practice DP-100 Questions With Certification guide Q&A from Training Expert PassReview
Free Microsoft DP-100 Test Practice Test Questions Exam Dumps
NEW QUESTION 76
You need to select a feature extraction method.
Which method should you use?
- A. Mutual information
- B. Kendall correlation
- C. Permutation Feature Importance
- D. Mood's median test
Answer: B
Explanation:
In statistics, the Kendall rank correlation coefficient, commonly referred to as Kendall's tau coefficient (after the Greek letter τ), is a statistic used to measure the ordinal association between two measured quantities.
It is a supported method of the Azure Machine Learning Feature selection.
Note: Both Spearman's and Kendall's can be formulated as special cases of a more general correlation coefficient, and they are both appropriate in this scenario.
Scenario: The MedianValue and AvgRoomsInHouse columns both hold data in numeric format. You need to select a feature selection algorithm to analyze the relationship between the two columns in more detail.
Reference:
https://docs.microsoft.com/en-us/azure/machine-learning/studio-module-reference/feature-selection-modules
NEW QUESTION 77
You need to visually identify whether outliers exist in the Age column and quantify the outliers before the outliers are removed.
Which three Azure Machine Learning Studio modules should you use in sequence? To answer, move the appropriate modules from the list of modules to the answer area and arrange them in the correct order.
Answer:
Explanation:
Explanation:
You can use the Clip Values module in Azure Machine Learning Studio, to identify and optionally replace data values that are above or below a specified threshold. This is useful when you want to remove outliers or replace them with a mean, a constant, or other substitute value.
References:
https://blogs.msdn.microsoft.com/azuredev/2017/05/27/data-cleansing-tools-in-azure-machine-learning/
https://docs.microsoft.com/en-us/azure/machine-learning/studio-module-reference/clip-values
NEW QUESTION 78
You create a pipeline in designer to train a model that predicts automobile prices.
Because of non-linear relationships in the data, the pipeline calculates the natural log (Ln) of the prices in the training data, trains a model to predict this natural log of price value, and then calculates the exponential of the scored label to get the predicted price.
The training pipeline is shown in the exhibit. (Click the
Training pipeline
You create a real-time inference pipeline from the training pipeline, as shown in the exhibit. (Click the Real-time pipeline tab.) Real-time pipeline
You need to modify the inference pipeline to ensure that the web service returns the exponential of the scored label as the predicted automobile price and that client applications are not required to include a price value in the input values.
Which three modifications must you make to the inference pipeline? Each correct answer presents part of the solution.
NOTE: Each correct selection is worth one point.
- A. Remove the Apply Math Operation module that replaces price with its natural log from the data flow.
- B. Replace the training dataset module with a data input that does not include the price column.
- C. Add a Select Columns module before the Score Model module to select all columns other than price.
- D. Connect the output of the Apply SQL Transformation to the Web Service Output module.
- E. Remove the Apply SQL Transformation module from the data flow.
- F. Replace the Web Service Input module with a data input that does not include the price column.
Answer: A,C,D
NEW QUESTION 79
You are building a binary classification model by using a supplied training set.
The training set is imbalanced between two classes.
You need to resolve the data imbalance.
What are three possible ways to achieve this goal? Each correct answer presents a complete solution NOTE: Each correct selection is worth one point.
- A. Resample the data set using under sampling or oversampling
- B. Use accuracy as the evaluation metric of the model.
- C. Normalize the training feature set.
- D. Penalize the classification
- E. Generate synthetic samples in the minority class.
Answer: A,B,E
NEW QUESTION 80
You need to implement a model development strategy to determine a user's tendency to respond to an ad.
Which technique should you use?
- A. Use a Split Rows module to partition the data based on centroid distance.
- B. Use a Relative Expression Split module to partition the data based on distance travelled to the event.
- C. Use a Relative Expression Split module to partition the data based on centroid distance.
- D. Use a Split Rows module to partition the data based on distance travelled to the event.
Answer: C
Explanation:
Explanation
Split Data partitions the rows of a dataset into two distinct sets.
The Relative Expression Split option in the Split Data module of Azure Machine Learning Studio is helpful when you need to divide a dataset into training and testing datasets using a numerical expression.
Relative Expression Split: Use this option whenever you want to apply a condition to a number column. The number could be a date/time field, a column containing age or dollar amounts, or even a percentage. For example, you might want to divide your data set depending on the cost of the items, group people by age ranges, or separate data by a calendar date.
Scenario:
Local market segmentation models will be applied before determining a user's propensity to respond to an advertisement.
The distribution of features across training and production data are not consistent References:
https://docs.microsoft.com/en-us/azure/machine-learning/studio-module-reference/split-data
Topic 1, Case Study 1
Overview
You are a data scientist in a company that provides data science for professional sporting events. Models will be global and local market data to meet the following business goals:
*Understand sentiment of mobile device users at sporting events based on audio from crowd reactions.
*Access a user's tendency to respond to an advertisement.
*Customize styles of ads served on mobile devices.
*Use video to detect penalty events.
Current environment
Requirements
* Media used for penalty event detection will be provided by consumer devices. Media may include images and videos captured during the sporting event and snared using social media. The images and videos will have varying sizes and formats.
* The data available for model building comprises of seven years of sporting event media. The sporting event media includes: recorded videos, transcripts of radio commentary, and logs from related social media feeds feeds captured during the sporting events.
*Crowd sentiment will include audio recordings submitted by event attendees in both mono and stereo Formats.
Advertisements
* Ad response models must be trained at the beginning of each event and applied during the sporting event.
* Market segmentation nxxlels must optimize for similar ad resporr.r history.
* Sampling must guarantee mutual and collective exclusivity local and global segmentation models that share the same features.
* Local market segmentation models will be applied before determining a user's propensity to respond to an advertisement.
* Data scientists must be able to detect model degradation and decay.
* Ad response models must support non linear boundaries features.
* The ad propensity model uses a cut threshold is 0.45 and retrains occur if weighted Kappa deviates from 0.1
+/-5%.
* The ad propensity model uses cost factors shown in the following diagram:
The ad propensity model uses proposed cost factors shown in the following diagram:
Performance curves of current and proposed cost factor scenarios are shown in the following diagram:
Penalty detection and sentiment
Findings
*Data scientists must build an intelligent solution by using multiple machine learning models for penalty event detection.
*Data scientists must build notebooks in a local environment using automatic feature engineering and model building in machine learning pipelines.
*Notebooks must be deployed to retrain by using Spark instances with dynamic worker allocation
*Notebooks must execute with the same code on new Spark instances to recode only the source of the data.
*Global penalty detection models must be trained by using dynamic runtime graph computation during training.
*Local penalty detection models must be written by using BrainScript.
* Experiments for local crowd sentiment models must combine local penalty detection data.
* Crowd sentiment models must identify known sounds such as cheers and known catch phrases. Individual crowd sentiment models will detect similar sounds.
* All shared features for local models are continuous variables.
* Shared features must use double precision. Subsequent layers must have aggregate running mean and standard deviation metrics Available.
segments
During the initial weeks in production, the following was observed:
*Ad response rates declined.
*Drops were not consistent across ad styles.
*The distribution of features across training and production data are not consistent.
Analysis shows that of the 100 numeric features on user location and behavior, the 47 features that come from location sources are being used as raw features. A suggested experiment to remedy the bias and variance issue is to engineer 10 linearly uncorrected features.
Penalty detection and sentiment
*Initial data discovery shows a wide range of densities of target states in training data used for crowd sentiment models.
*All penalty detection models show inference phases using a Stochastic Gradient Descent (SGD) are running too stow.
*Audio samples show that the length of a catch phrase varies between 25%-47%, depending on region.
*The performance of the global penalty detection models show lower variance but higher bias when comparing training and validation sets. Before implementing any feature changes, you must confirm the bias and variance using all training and validation cases.
NEW QUESTION 81
You have a dataset that contains 2,000 rows. You are building a machine learning classification model by using Azure Learning Studio. You add a Partition and Sample module to the experiment.
You need to configure the module. You must meet the following requirements:
Divide the data into subsets
Assign the rows into folds using a round-robin method
Allow rows in the dataset to be reused
How should you configure the module? To answer, select the appropriate options in the dialog box in the answer area.
NOTE: Each correct selection is worth one point.
Answer:
Explanation:
Explanation:
Use the Split data into partitions option when you want to divide the dataset into subsets of the data. This option is also useful when you want to create a custom number of folds for cross-validation, or to split rows into several groups.
Add the Partition and Sample module to your experiment in Studio (classic), and connect the dataset.
For Partition or sample mode, select Assign to Folds.
Use replacement in the partitioning: Select this option if you want the sampled row to be put back into the pool of rows for potential reuse. As a result, the same row might be assigned to several folds.
If you do not use replacement (the default option), the sampled row is not put back into the pool of rows for potential reuse. As a result, each row can be assigned to only one fold.
Randomized split: Select this option if you want rows to be randomly assigned to folds.
If you do not select this option, rows are assigned to folds using the round-robin method.
References:
https://docs.microsoft.com/en-us/azure/machine-learning/studio-module-reference/partition-and-sample
NEW QUESTION 82
You are tuning a hyperparameter for an algorithm. The following table shows a data set with different hyperparameter, training error, and validation errors.
Use the drop-down menus to select the answer choice that answers each question based on the information presented in the graphic.
Answer:
Explanation:
Explanation:
Box 1: 4
Choose the one which has lower training and validation error and also the closest match.
Minimize variance (difference between validation error and train error).
Box 2: 5
Minimize variance (difference between validation error and train error).
Reference:
https://medium.com/comet-ml/organizing-machine-learning-projects-project-management-guidelines-2d2b85651bbd
NEW QUESTION 83
You run an automated machine learning experiment in an Azure Machine Learning workspace. Information about the run is listed in the table below:
You need to write a script that uses the Azure Machine Learning SDK to retrieve the best iteration of the experiment run.
Which Python code segment should you use?
- A.

- B.

- C.

- D.

- E.

Answer: B
Explanation:
Explanation
Explanation:
The get_output method on automl_classifier returns the best run and the fitted model for the last invocation.
Overloads on get_output allow you to retrieve the best run and fitted model for any logged metric or for a particular iteration.
In [ ]:
best_run, fitted_model = local_run.get_output()
Reference:
https://notebooks.azure.com/azureml/projects/azureml-getting-started/html/how-to-use-azureml/automated- machine-learning/classification-with-deployment/auto-ml-classification-with-deployment.ipynb
NEW QUESTION 84
You create an experiment in Azure Machine Learning Studio. You add a training dataset that contains 10,000 rows. The first 9,000 rows represent class 0 (90 percent).
The remaining 1,000 rows represent class 1 (10 percent).
The training set is imbalances between two classes. You must increase the number of training examples for class 1 to 4,000 by using 5 data rows. You add the Synthetic Minority Oversampling Technique (SMOTE) module to the experiment.
You need to configure the module.
Which values should you use? To answer, select the appropriate options in the dialog box in the answer area.
NOTE: Each correct selection is worth one point.
Answer:
Explanation:
Explanation
Box 1: 300
You type 300 (%), the module triples the percentage of minority cases (3000) compared to the original dataset (1000).
Box 2: 5
We should use 5 data rows.
Use the Number of nearest neighbors option to determine the size of the feature space that the SMOTE algorithm uses when in building new cases. A nearest neighbor is a row of data (a case) that is very similar to some target case. The distance between any two cases is measured by combining the weighted vectors of all features.
By increasing the number of nearest neighbors, you get features from more cases.
By keeping the number of nearest neighbors low, you use features that are more like those in the original sample.
References:
https://docs.microsoft.com/en-us/azure/machine-learning/studio-module-reference/smote
NEW QUESTION 85
You are creating a new Azure Machine Learning pipeline using the designer.
The pipeline must train a model using data in a comma-separated values (CSV) file that is published on a website. You have not created a dataset for this file.
You need to ingest the data from the CSV file into the designer pipeline using the minimal administrative effort.
Which module should you add to the pipeline in Designer?
- A. Enter Data Manually
- B. Convert to CSV
- C. Dataset
- D. Import Data
Answer: C
Explanation:
The preferred way to provide data to a pipeline is a Dataset object. The Dataset object points to data that lives in or is accessible from a datastore or at a Web URL. The Dataset class is abstract, so you will create an instance of either a FileDataset (referring to one or more files) or a TabularDataset that's created by from one or more files with delimited columns of data.
Example:
from azureml.core import Dataset
iris_tabular_dataset = Dataset.Tabular.from_delimited_files([(def_blob_store, 'train-dataset/iris.csv')]) Reference:
https://docs.microsoft.com/en-us/azure/machine-learning/how-to-create-your-first-pipeline
NEW QUESTION 86
You are performing feature engineering on a dataset.
You must add a feature named CityName and populate the column value with the text London.
You need to add the new feature to the dataset.
Which Azure Machine Learning Studio module should you use?
- A. Preprocess Text
- B. Execute Python Script
- C. Edit Metadata
- D. Latent Dirichlet Allocation
Answer: C
Explanation:
Explanation
Typical metadata changes might include marking columns as features.
References:
https://docs.microsoft.com/en-us/azure/machine-learning/studio-module-reference/edit-metadata
NEW QUESTION 87
You plan to preprocess text from CSV files. You load the Azure Machine Learning Studio default stop words list.
You need to configure the Preprocess Text module to meet the following requirements:
* Ensure that multiple related words from a single canonical form.
* Remove pipe characters from text.
* Remove words to optimize information retrieval.
Which three options should you select? To answer, select the appropriate options in the answer area.
NOTE: Each correct selection is worth one point.
Answer:
Explanation:
Explanation
Box 1: Remove stop words
Remove words to optimize information retrieval.
Remove stop words: Select this option if you want to apply a predefined stopword list to the text column. Stop word removal is performed before any other processes.
Box 2: Lemmatization
Ensure that multiple related words from a single canonical form.
Lemmatization converts multiple related words to a single canonical form Box 3: Remove special characters Remove special characters: Use this option to replace any non-alphanumeric special characters with the pipe | character.
References:
https://docs.microsoft.com/en-us/azure/machine-learning/studio-module-reference/preprocess-text
NEW QUESTION 88
You create a binary classification model by using Azure Machine Learning Studio.
You must tune hyperparameters by performing a parameter sweep of the model. The parameter sweep must meet the following requirements:
* iterate all possible combinations of hyperparameters
* minimize computing resources required to perform the sweep
You need to perform a parameter sweep of the model.
Which parameter sweep mode should you use?
- A. Entire grid
- B. Sweep clustering
- C. Random sweep
- D. Random grid
Answer: D
Explanation:
Maximum number of runs on random grid: This option also controls the number of iterations over a random sampling of parameter values, but the values are not generated randomly from the specified range; instead, a matrix is created of all possible combinations of parameter values and a random sampling is taken over the matrix. This method is more efficient and less prone to regional oversampling or undersampling.
If you are training a model that supports an integrated parameter sweep, you can also set a range of seed values to use and iterate over the random seeds as well. This is optional, but can be useful for avoiding bias introduced by seed selection.
Incorrect Answers:
B: If you are building a clustering model, use Sweep Clustering to automatically determine the optimum number of clusters and other parameters.
C: Entire grid: When you select this option, the module loops over a grid predefined by the system, to try different combinations and identify the best learner. This option is useful for cases where you don't know what the best parameter settings might be and want to try all possible combination of values.
Reference:
https://docs.microsoft.com/en-us/azure/machine-learning/studio-module-reference/tune-model- hyperparameters
NEW QUESTION 89
Note: This question is part of a series of questions that present the same scenario. Each question in the series contains a unique solution that might meet the stated goals. Some question sets might have more than one correct solution, while others might not have a correct solution.
After you answer a question in this section, you will NOT be able to return to it. As a result, these questions will not appear in the review screen.
You are using Azure Machine Learning to run an experiment that trains a classification model.
You want to use Hyperdrive to find parameters that optimize the AUC metric for the model. You configure a HyperDriveConfig for the experiment by running the following code:
You plan to use this configuration to run a script that trains a random forest model and then tests it with validation dat a. The label values for the validation data are stored in a variable named y_test variable, and the predicted probabilities from the model are stored in a variable named y_predicted.
You need to add logging to the script to allow Hyperdrive to optimize hyperparameters for the AUC metric.
Solution: Run the following code:
Does the solution meet the goal?
- A. No
- B. Yes
Answer: A
Explanation:
Explanation
Use a solution with logging.info(message) instead.
Note: Python printing/logging example:
logging.info(message)
Destination: Driver logs, Azure Machine Learning designer
Reference:
https://docs.microsoft.com/en-us/azure/machine-learning/how-to-debug-pipelines
NEW QUESTION 90
You need to implement a new cost factor scenario for the ad response models as illustrated in the performance curve exhibit.
Which technique should you use?
- A. Set the threshold to 0.2 and retrain if weighted Kappa deviates +/- 5% from 0.6.
- B. Set the threshold to 0.75 and retrain if weighted Kappa deviates +/- 5% from 0.15.
- C. Set the threshold to 0.05 and retrain if weighted Kappa deviates +/- 5% from 0.5.
- D. Set the threshold to 0.5 and retrain if weighted Kappa deviates +/- 5% from 0.45.
Answer: D
Explanation:
Scenario:
Performance curves of current and proposed cost factor scenarios are shown in the following diagram: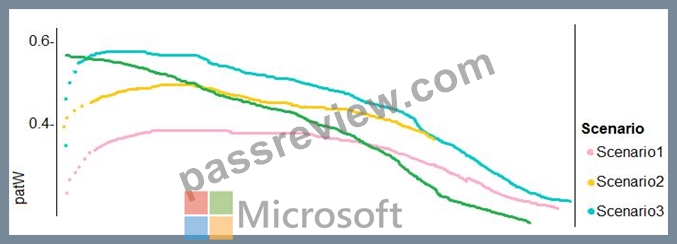
The ad propensity model uses a cut threshold is 0.45 and retrains occur if weighted Kappa deviated from 0.1 +/- 5%.
NEW QUESTION 91
......
Prepare Top Microsoft DP-100 Exam Audio Study Guide Practice Questions Edition: https://www.passreview.com/DP-100_exam-braindumps.html
Dumps Practice Exam Questions Study Guide for the DP-100 Exam: https://drive.google.com/open?id=18L3BuaHcK2tIPtEFWQakydaZ735Gg-rY